Second task
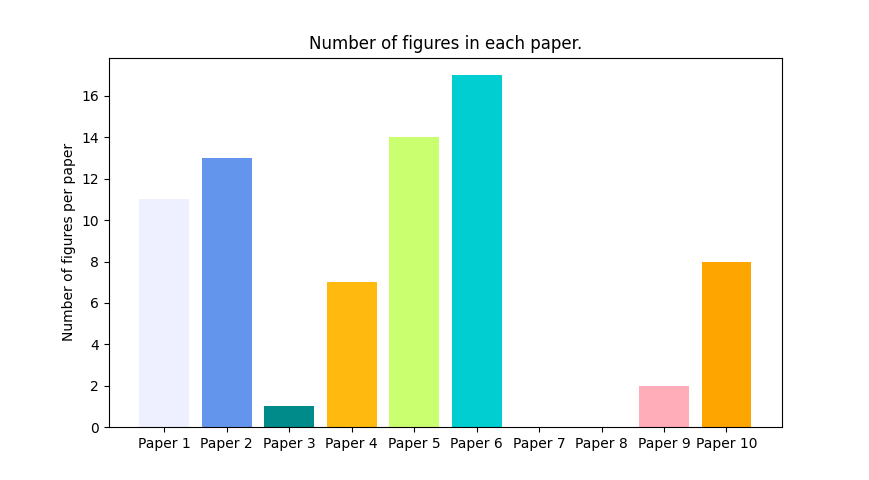
For this task we have to represent in some way how many figures there are in each paper, for that i used a bar graph which data comes from finding all of the ‘figure’ tags with the method ‘find_all’ from BeautifulSoup and then counting the number of tags per paper and appending that number to a list. You’ll get the bar graph aas soons as you execute the Python file called ‘visualization.py’
For executing the ‘visualization.py’ file, inside the ‘2ndAssigment’ directory, run:
python visualization.py
As an output you’ll get a bar graph, each bar represents how many figures there are in each article.
Output visualization: